xtop Profiler Guide
The xtop profiler provides on-demand analysis of .xpti profile data collected by xtop run. It offers timeline visualization, map-level summaries, and task-level inspection.
Analysis commands (
xtop task,xtop map,xtop convert,xtop open) do not require root privileges. Only data collection (xtop run) requiressudo.
Prerequisites
Before using the profiler, you need a .xpti profile file:
# Collect a profile
sudo xtop run -- ./your_application [args...]
This generates a .xpti file (SQLite format) containing host events, device events, cache metrics, and hardware topology. See the xtop User Guide for details on data collection.
Optional dependencies:
matplotlib– required forxtop map --plot(PNG plot generation)flask– required forxtop open(Perfetto UI server)
Quick Reference
| Command | Purpose | Example |
|---|---|---|
xtop convert <file> | Convert to Perfetto format | xtop convert profile.xpti |
xtop open <file> | Open in Perfetto UI | xtop open profile.xpti |
xtop map <file> | Full execution summary | xtop map profile.xpti |
xtop map <file> --plot | Generate analysis plots (PNG) | xtop map profile.xpti --plot |
xtop map <file> --json | Export analysis as JSON | xtop map profile.xpti --json |
xtop task <file> | List all tasks with timing | xtop task profile.xpti |
xtop task <file> <id> | Detailed analysis of one task | xtop task profile.xpti 17 |
Timeline Visualization
The fastest way to understand your application’s behavior is to visualize the full execution timeline in Perfetto UI.
Convert to Perfetto Format
xtop convert profile.xpti
Options:
| Option | Description | Default |
|---|---|---|
-o, --output <path> | Output file path | <input>.perfetto-trace |
--json | Generate legacy JSON format instead of protobuf | off |
--debug | Print debug information during conversion | off |
Output:
[xtop] Converting profile.xpti -> profile.perfetto-trace
[xtop] Done: 2370 host events, 4352 device events
The generated .perfetto-trace file can be opened at https://ui.perfetto.dev.
Reading the Timeline
The screenshot below shows a Perfetto timeline from a sort example (sort_with_ptr):
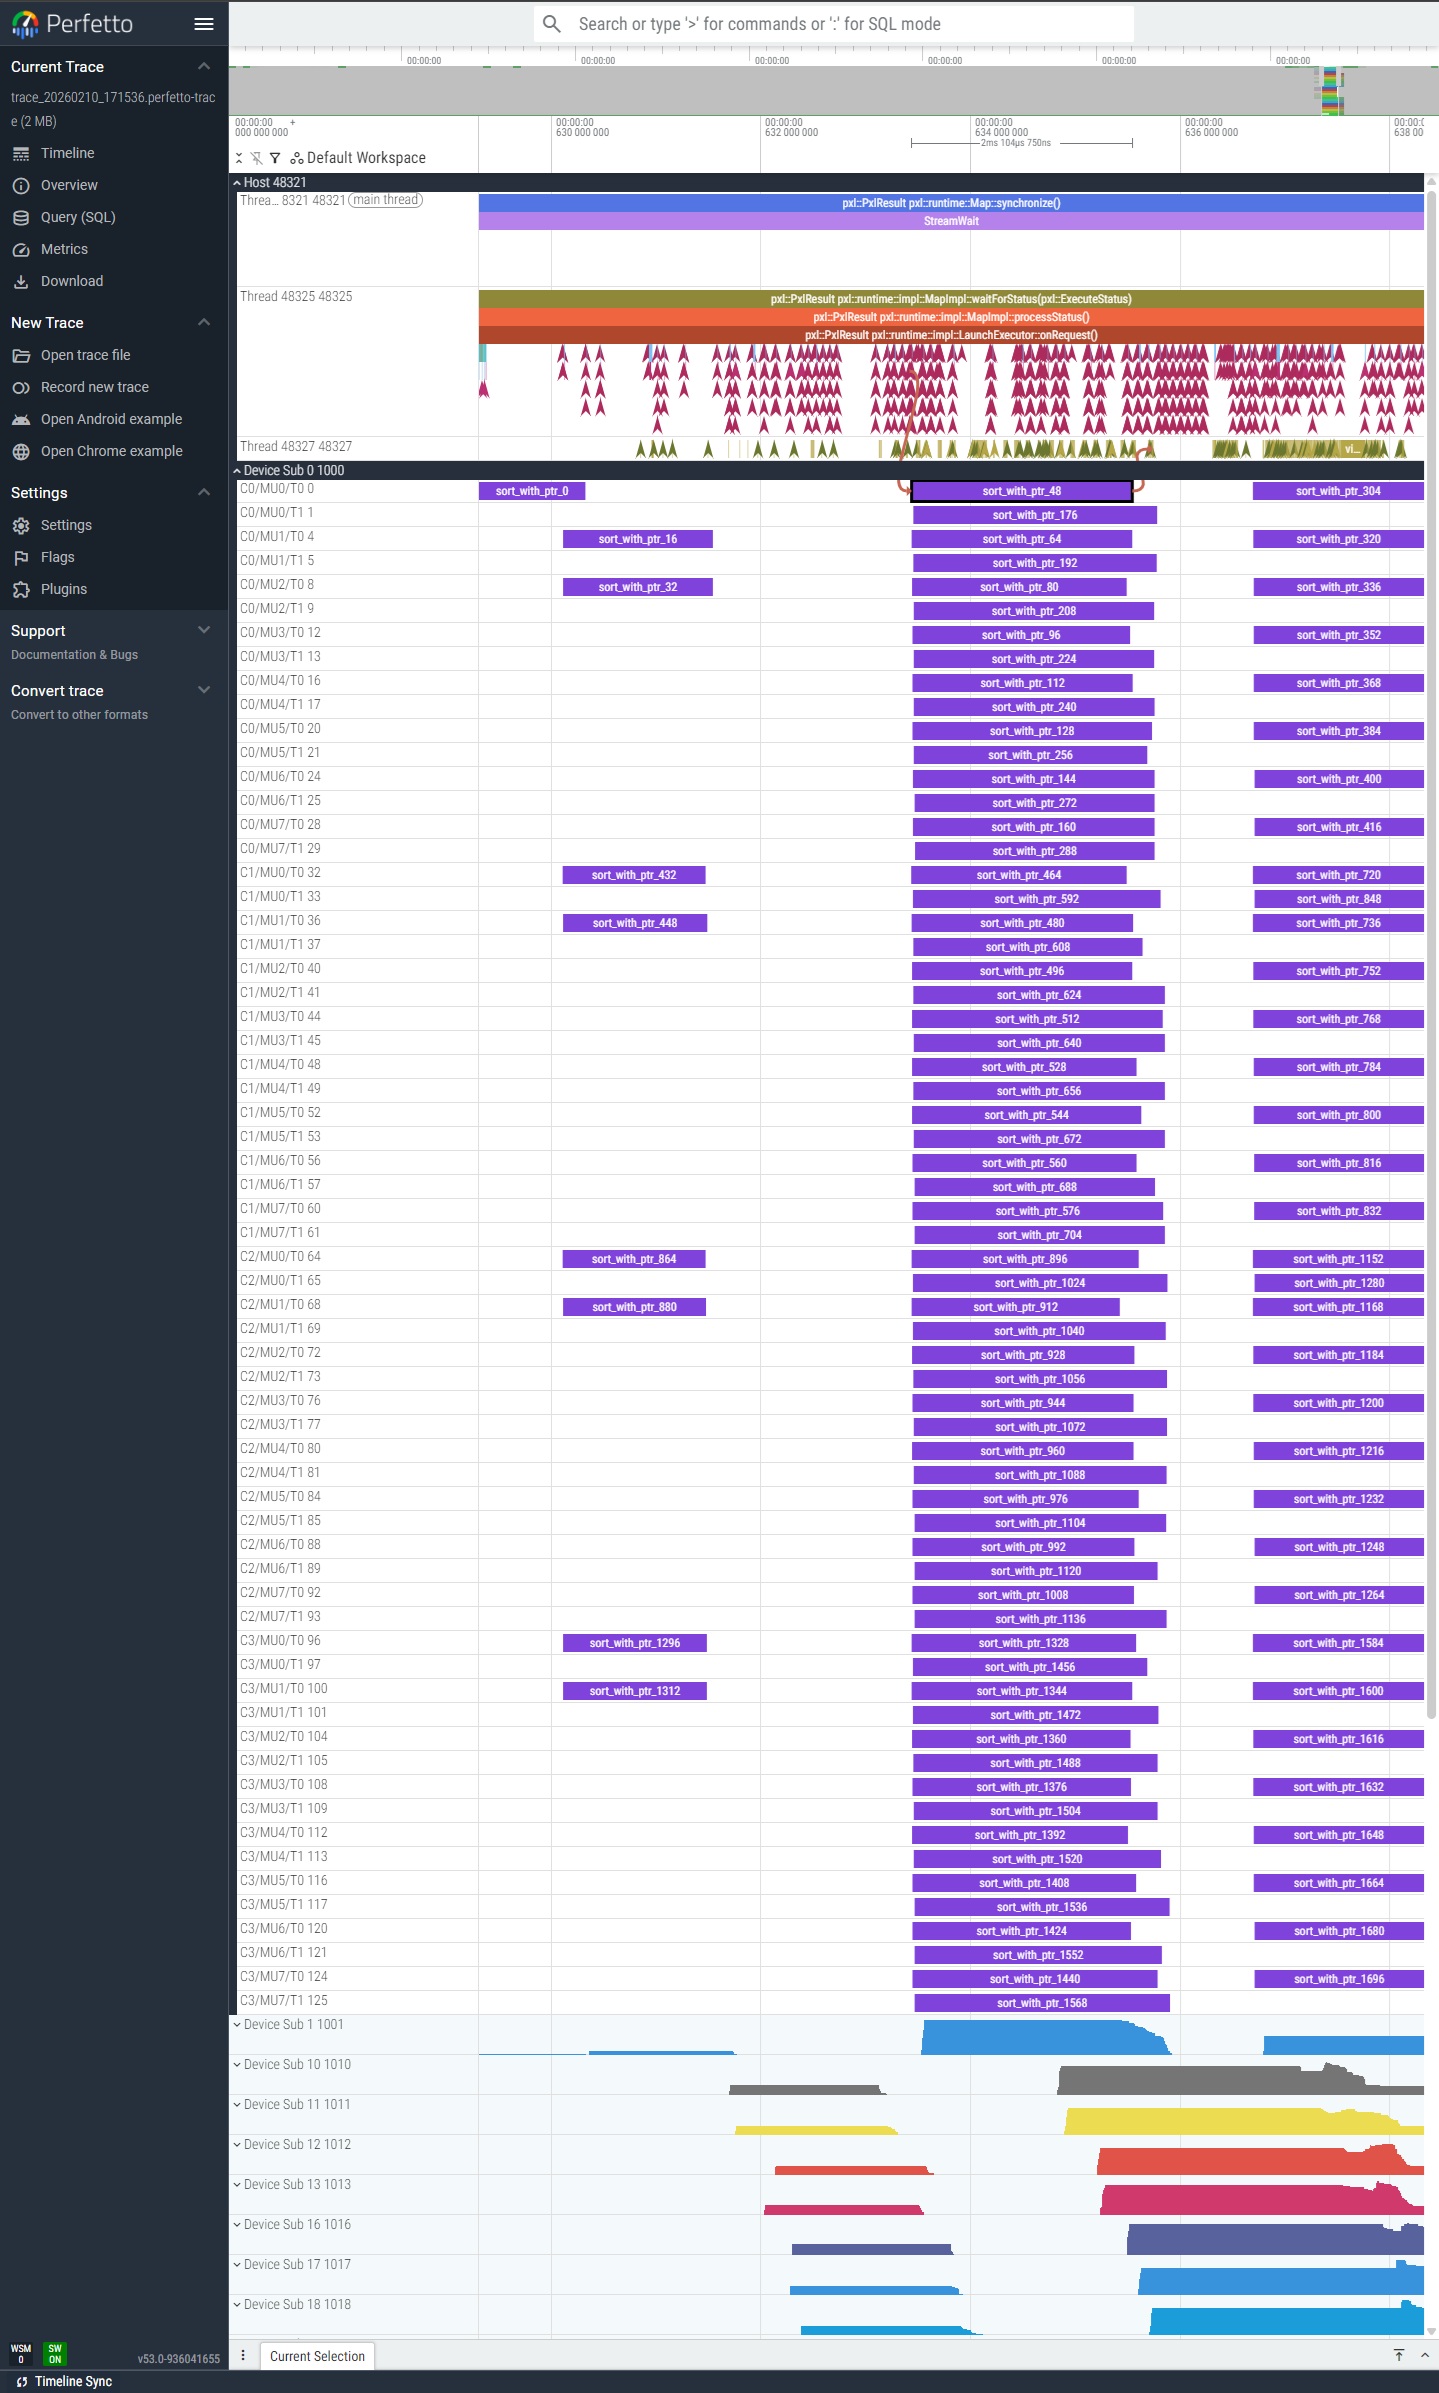
The timeline is organized into tracks:
| Track | Events | Description |
|---|---|---|
| Host | TaskDispatch / TaskComplete | Host-side API calls. Each span represents the time from dispatch to completion of a task. |
| Device | Launch / Terminate | Device-side kernel execution on each Sub/Cluster/MU/Thread. |
| Flow arrows | Host to Device | Visual connection from host dispatch to the corresponding device execution. |
What to look for:
- Gaps in host tracks indicate scheduling delays or synchronization waits.
- Uneven device track lengths suggest workload imbalance across hardware threads.
- Long flow arrows mean high overhead between host dispatch and device execution.
Open in Perfetto UI
xtop open profile.xpti
Starts a local web server and opens the trace directly in your browser, without manual upload.
Options:
| Option | Description | Default |
|---|---|---|
-p, --port <port> | HTTP server port | 8888 |
--debug | Print debug information | off |
# Open a single profile
xtop open profile.xpti

# Open a directory of traces
xtop open ./xtop_profile/

# Use custom port
xtop open profile.xpti --port 9999
Supported file types: .xpti (auto-converts), .json, .perfetto-trace
Requires flask. Install with: pip install flask
Map Analysis
Analyze the overall Map execution with parallelism, load balance, cache efficiency, and bottleneck detection.
Basic Summary
xtop map profile.xpti
Options:
| Option | Description | Default |
|---|---|---|
--plot | Generate PNG plot with analysis charts | off |
--json | Output analysis results as JSON | off |
-o, --output <path> | Output file path (for --plot or --json) | auto |
Output:
============================================================
 MAP SUMMARY
============================================================

[Hardware]
  Subs: 2   Clusters/Sub: 2   MUs/Cluster: 4   Threads/MU: 8
  Total threads    : 128
  MU frequency     : 1100 MHz

[Duration - Host]
  Wall time        : 1,745.20 ms
  Task count       : 1,024
  avg              : 7.08 ms
  median           : 6.92 ms
  min              : 3.21 ms
  max              : 24.91 ms
  std_dev          : 2.34 ms

[Duration - Device]
  Task count       : 1,024
  avg              : 6.55 ms
  median           : 6.40 ms
  min              : 2.98 ms
  max              : 23.12 ms
  std_dev          : 2.10 ms

[Parallelism - Host]
  max_concurrent   : 128
  avg_concurrent   : 95.3
  ramp_up          : 45.23 ms
  max_hold         : 1,610.74 ms
  ramp_down        : 89.23 ms

[Parallelism - Device]
  max_concurrent   : 128
  avg_concurrent   : 94.5
  ramp_up          : 48.90 ms
  max_hold         : 1,605.64 ms
  ramp_down        : 90.66 ms

[Skew] (Sub/Cluster distribution)
  Sub0             : ######### 52%
  Sub1             : ######## 48%
  balance_score    : 0.96 (1.0 = perfectly even)

[Overhead] (scheduling + communication)
  avg_overhead     : 0.53 ms
  p95_overhead     : 1.82 ms
  max_overhead     : 6.41 ms

[Cache]
  L1 hit rate      : 92.1% (r:95.0% w:88.0%)
  L2 hit rate      : 74.3%
  L3 hit rate      : 88.9%

[Memory Bandwidth] (estimated from L3)
  read commands    : 50,000
  write commands   : 30,000
  cache line size  : 64 bytes
  time span        : 1,745.20 ms
  estimated BW     : 2.93 GB/s

[Stragglers]
  straggler_ratio  : 1.23x (1.0 = even, >2.0 = imbalanced)
  Top busy:
    sub=0 cluster=0 mu=0 thread=0   120 tasks, avg 7.25 ms
    sub=1 cluster=1 mu=2 thread=3   115 tasks, avg 7.18 ms
  Least busy:
    sub=0 cluster=1 mu=3 thread=7    95 tasks, avg 6.80 ms

[Idle]
  total_idle       : 12.34 ms
  total_active     : 1,732.86 ms
  idle_percentage  : 0.7%

[Utilization]
  active_threads   : 128 / 128 (100.0%)
  total_tasks      : 1,024

============================================================
Sections explained:
| Section | What it tells you |
|---|---|
| Hardware | Device topology and clock frequency from profile metadata. |
| Duration | Task execution time statistics from both host and device perspectives. Large gap between Host and Device averages indicates high scheduling overhead. |
| Parallelism | How many tasks run concurrently over time. Ramp-up is time to reach peak concurrency; ramp-down is time from peak to completion. Long ramp-down suggests stragglers. |
| Skew | Task distribution across Subs and Clusters. A balance score close to 1.0 means work is evenly distributed. |
| Overhead | Difference between host-measured and device-measured task duration. Includes scheduling latency, driver communication, and queue wait time. |
| Cache | Aggregate cache hit rates. Low L2 hit rate may indicate poor data locality. |
| Memory Bandwidth | Estimated from L3 cache command counts and cache line size. This is an approximation, not precise measurement. |
| Stragglers | Threads with disproportionately high or low workload. A straggler ratio above 2.0 indicates significant imbalance. |
| Idle | Time gaps between consecutive tasks on each thread. High idle percentage suggests underutilization. |
| Utilization | Fraction of hardware threads that received at least one task. |
Generate Plots
xtop map profile.xpti --plot -o analysis.png
Generates a multi-panel PNG image for visual analysis. The screenshot below shows the plot output from a sort example:
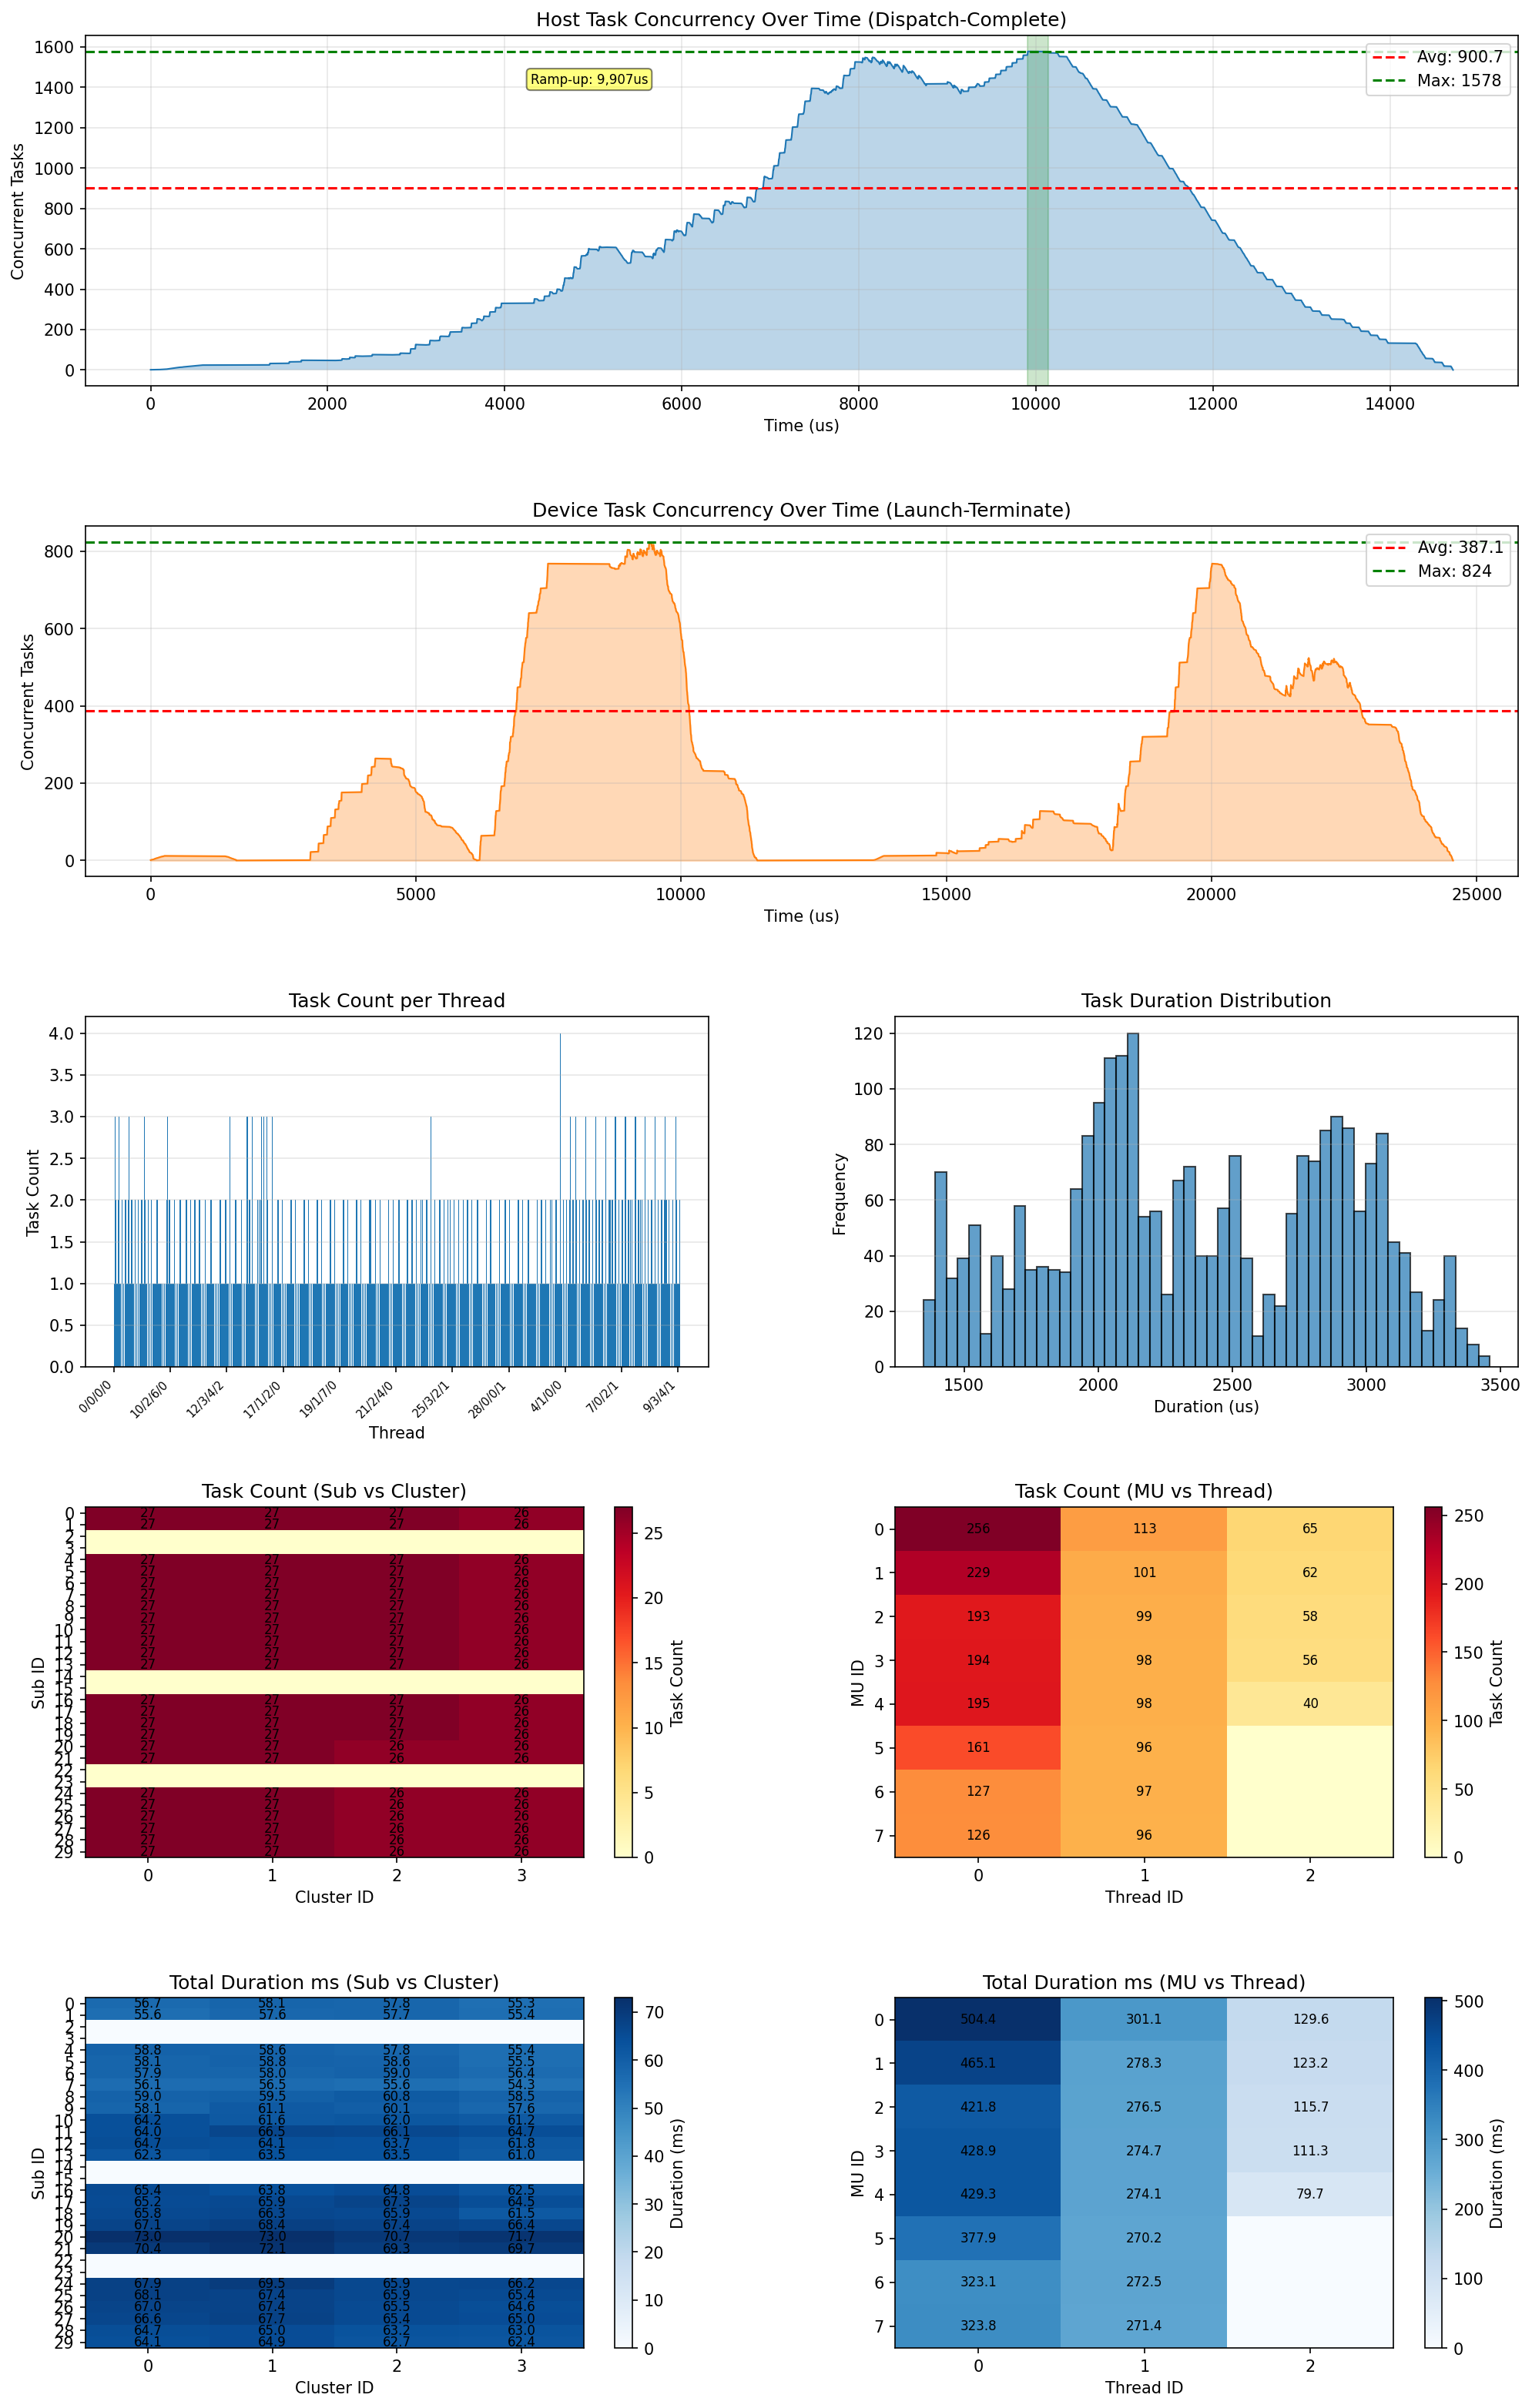
The plot contains 8 panels:
| Panel | Description |
|---|---|
| Host concurrency over time | Number of concurrent host tasks (Dispatch-Complete) at each point in time. The red dashed line shows peak concurrency. |
| Device concurrency over time | Number of concurrent device tasks (Launch-Terminate). Compare with host concurrency to spot scheduling overhead. |
| Task count per thread | Bar chart showing how many tasks each hardware thread executed. Even bars indicate good load balance. |
| Duration histogram | Distribution of individual task execution times. A long tail indicates straggler tasks. |
| Sub/Cluster task count heatmap | Task count distribution across the Sub x Cluster grid. Darker cells received more tasks. |
| MU/Thread task count heatmap | Task count distribution across the MU x Thread grid. |
| Sub/Cluster duration heatmap | Total execution time per Sub x Cluster combination. Uneven colors indicate workload imbalance. |
| MU/Thread duration heatmap | Total execution time per MU x Thread combination. |
Requires matplotlib. Install with: pip install matplotlib
Export as JSON
xtop map profile.xpti --json -o analysis.json
Exports the full analysis result as a JSON file for programmatic consumption or integration with other tools.
Task Analysis
Inspect individual task execution timing, hardware placement, and per-task cache statistics.
List All Tasks
xtop task profile.xpti
Options:
| Option | Description | Default |
|---|---|---|
--sort {id,active,overhead} | Sort order | id |
--filter <expr> | Filter tasks (e.g., sub=0, cluster=1) | none |
--limit N | Limit number of rows | all |
Output:
========================================================
 TASK LIST
========================================================

 ID     Kernel           Active       Overhead     Sub    Cluster
------  -------          -------      -------      ---    -------
 0      sort_kernel      7.08 ms      1.52 ms      0      0
 1      sort_kernel      6.92 ms      0.12 ms      0      1
 2      sort_kernel      8.21 ms      3.41 ms      1      0
 ...
------
 Total: 1024 tasks
Columns explained:
| Column | Description |
|---|---|
| ID | Task index (assigned at dispatch) |
| Kernel | Kernel function name |
| Active | Device execution time (Launch to Terminate) |
| Overhead | Host duration minus device active time (scheduling + communication) |
| Sub | Sub where the task executed |
| Cluster | Cluster where the task executed |
Examples:
# Sort by longest execution time
xtop task profile.xpti --sort active

# Show only tasks on Sub 0
xtop task profile.xpti --filter sub=0

# Top 10 slowest tasks
xtop task profile.xpti --sort active --limit 10
Task Detail
xtop task profile.xpti 17
Shows comprehensive timing breakdown, hardware placement, cache statistics, and diagnostic messages for a single task.
Output:
============================================================
 Task 17 (kernel: sort_kernel)
============================================================

[Timing]
  dispatch(host)  : 12384 us
  complete(host)  : 24118 us
  host_duration   : 11.73 ms

  launch(device)  : 500 ticks
  terminate       : 9942 ticks
  active_time     : 9.44 ms

  overhead        : 2.29 ms (19.5%)

[Placement]
  sub / cluster / mu / thread
  0 / 0 / 3 / 2

[Cache] (task time window)
  L1 hit   : 92.1% (512 samples)
  L2 hit   : 74.3% (256 samples)
  L3 hit   : 88.9% (64 samples)

[Diagnosis]
  ! High overhead (19.5% of host duration)
  ! L2 miss rate above threshold
Sections explained:
| Section | Description |
|---|---|
| Timing | Host-side timestamps (dispatch/complete) and device-side timestamps (launch/terminate). Overhead = host_duration - active_time. |
| Placement | Which Sub/Cluster/MU/Thread executed this task. |
| Cache | L1/L2/L3 hit rates during the task’s time window. Sample count indicates data availability. |
| Diagnosis | Automated warnings: high overhead, low cache hit rates, or other anomalies. |
Typical Workflow
A common profiling workflow:
# 1. Collect profile data
sudo xtop run -- ./my_application

# 2. Visualize the full timeline
xtop open profile.xpti

# 3. Quick overview -- how well did the Map execute?
xtop map profile.xpti

# 4. Generate analysis plots
xtop map profile.xpti --plot

# 5. Identify slow tasks
xtop task profile.xpti --sort active --limit 10

# 6. Investigate a specific slow task
xtop task profile.xpti 17
What to Look For
| Symptom | Where to check | Possible cause |
|---|---|---|
| Long wall time | xtop map Duration section | Too few tasks, or stragglers |
| High overhead | xtop map Overhead section | Scheduling bottleneck |
| Uneven distribution | xtop map Skew / Stragglers | Data-dependent workload imbalance |
| Low cache hit rate | xtop map Cache section | Poor data locality |
| Long ramp-down | xtop map Parallelism section | Straggler tasks holding up completion |
| Individual slow task | xtop task <file> <id> | Cache misses, large data set |