Introduction
The MX Performance Simulator (MXPefSim) is a performance estimation tool developed by XCENA to provide performance modeling for the manycore-based near-data processing (NDP) systems.
The main goal of MXPerfSim is to support design space exploration of manycore-based near-data acceleration architecture for research purpose. Therefore, instead of providing performance metrics that closely resemble those of the MX1 product, MXPerfSim targets to support design space exploration by presenting performance trends under various design choices.
How to use
1. Quick start
-
Get docker image from Docker Hub (xcenadev/sdk - Docker Image Docker Hub) -
Setup docker container (please follow until Step 4 in Emulator on Docker XCENA SDK Docs) -
Move to emulator folder and type
./run.sh --trace_dump <trace_dump_path>to launch QEMU with memory trace dumper enabled.<trace_dump_path>is an optional argument which designates path of output memory trace files (default: mxperfsim_traces). -
You will be at
/root/sdkfolder when QEMU is launched. Move to any folder which contains MU kernel code and build script that you want to get traces from, and build the MU kernel. -
Move to
/root/sdkfolder in QEMU and type./generate_traces.sh <executable_path>.<executable_path>is the path of executable that you built in Step 4. -
After the trace generation finishes, exit QEMU (type
ctrl+a, x) and move to MXPerfSim folder (cd ../MXPerfSim). -
Type
run_mxperfsim.sh <config_file> <mu_trace_prefix> <stats_file_prefix>to execute performance simulation.<config_file>is the path of configuration file (examples are located atconfigs/examples),<mu_trace_prefix>is the path where memory trace files are located (if you run trace generation with default path,<mu_trace_prefix>is../emulator/mxperfsim_traces), and<stats_file_prefix>is the location that output statistics files will be created. - You can run simulation directly by executing the following command in terminal.
<overrided_parameters>are optional parameters that you want to overwrite the values specified in configuration file.
./build/release/mxperfsim <config_file> <overrided_parameters>
Configuration file inputs hardware parameters to the simulator for performance simulation. Main parameters include:
-
Number of memory execution unit (MU) clusters
-
Size of L1/L2/L3 caches
-
Number of L3 cache slices (must be power of 2)
-
Associativity of L3 caches
-
Hit latency of L3 caches
-
Queue latency between HW modules (except the internal queues of MU clusters)
-
Number of DRAM channels (must be power of 2)
For more detailed description about simulation parameters, please refer to Appendix.A: MXPerfSim parameter description.
Once output statistics are generated by MXPerfSim, they can be visualized by using plotting scripts provided with the simulator.
You can run plotting script by executing following command in terminal. <plot_mode> means the type of plot generation. When plot_mode is 0, the plotting script runs in scalability mode and generates plots that show trend of each performance metrics over different number of MU clusters. If plot_mode is 1, the script runs in interval mode and generates plots that show trend of performance metrics over time for a given number of MU clusters. To run script in scalability mode, you have to get statistics of the target workload with different number of MU clusters, starting from 1.
python3 auto_plotter.py <plot_mode>
2. Understanding outputs
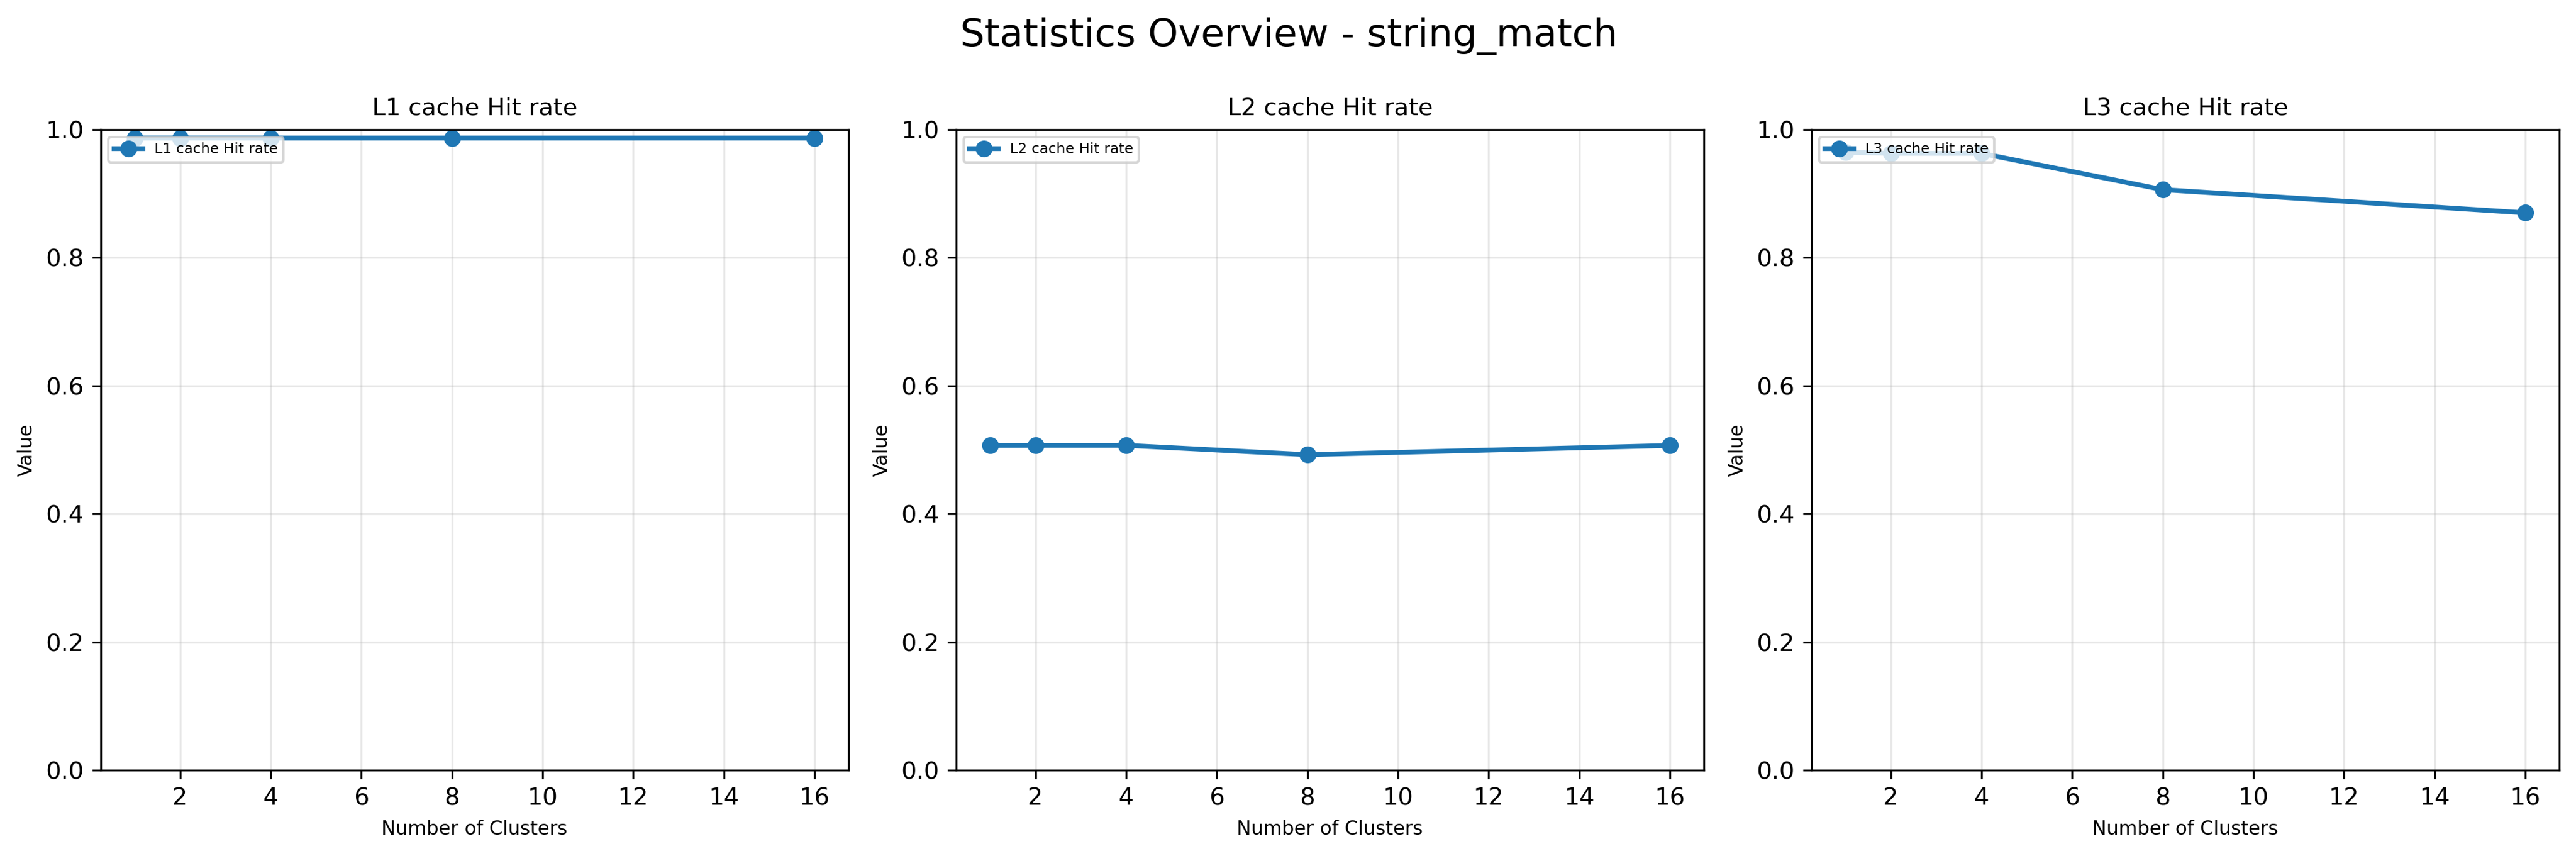
Since the most important system factor for memory-bounded workloads is hit rate of caches (i.e., how much portion of memory access can be filtered by the cache hierarchy), The core statistics provided by the MX Performance Simulator are performance-related metrics of the cache hierarchy. Specifically, the MX Performance Simulator produces the following statistics as simulation outputs.
-
MU thread: number of load/stores per thread, average interval of load instructions in terms of number of instructions or cycles
-
Cache: hit count, miss count, evict count, bypass count of individual caches, as well as aggregated statistics for each cache level.
-
DRAM: number of total reads/writes
Output statistics for MU clusters are sorted by cluster ID. In other words, statistics for MU thread, L1 cache, L2 cache are grouped by cluster ID and displayed in cluster ID order.
While MXPerfSim produces text-based output statistics, they also can be visualized using python scripts.
Overview
MXPerfSim is a specialized tool designed to estimate the performance of the “MX1-like” system for a given workload. By adjusting the configuration of hardware IPs or fine-tuning specific parameter values within a range analogous to that of the manycore-based NDP system, it enables design space exploration and supports data-driven decision-making during the architectural design phase of next-generation MX products.
For memory-bound workloads, the single most critical determinant of system performance is the efficiency with which the cache hierarchy filters DRAM accesses.
Accordingly, the performance simulator utilizes load/store traces generated by the MX1’s Memory Execution Units (MUs), applying concurrency to MU threads’ cache memory accesses. MXPerfSim’s objective is to deliver meaningful, cache memory-related performance metrics that closely reflect real-world behavior. Therefore, cache memory is implemented using detailed timing model, while the modeling of remaining hardware components (e.g. bus, DRAM) are relatively simple.
Target domain
Since XCENA’s products are fundamentally designed to accelerate memory-bound workloads, the dominant factor influencing application performance is the cache memory subsystem. Accordingly, the simulator focuses on collecting detailed cache-related statistics. The overall implementation can be summarized as follows:
Simplified MU Thread Timing Model
-
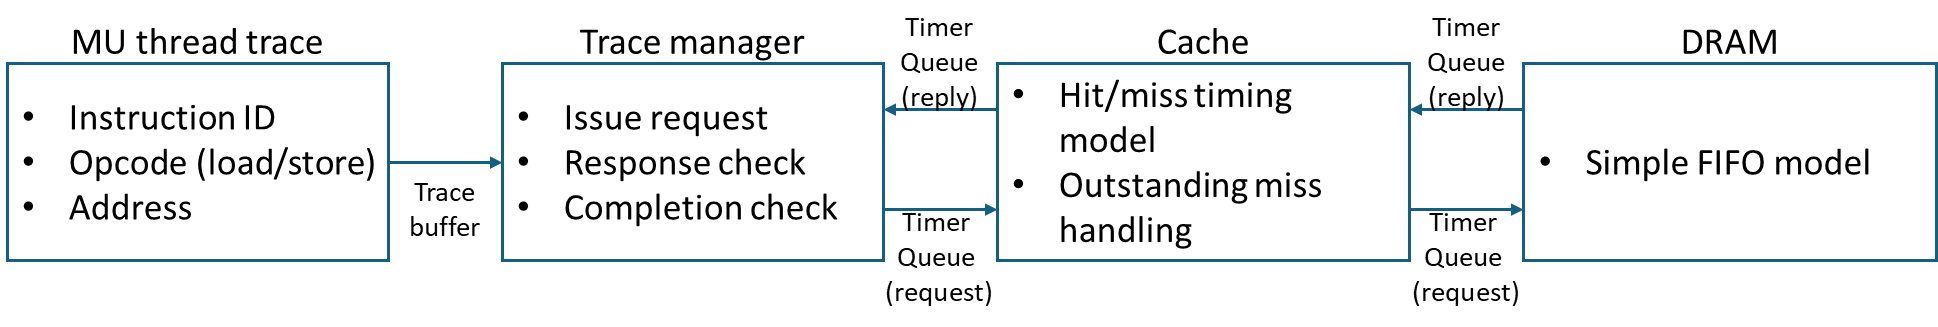
Based on the trace manager shown in the block diagram.
-
Only memory instructions are simulated; compute instructions are modeled as simple latency gaps proportional to the number of intervening memory instructions (gap × 1 cycle).
-
Each MU thread issues at most one outstanding load at a time, following a single-load model: a new request is issued only when the response to the previous load has been received.
Excluded Components
- Certain IP blocks, such as instruction caches, TLBs, and cache/bus schedulers, are not modeled.
Cache Timing Model (L1–L3)
-
Provides a relatively detailed timing representation.
-
Beyond simple hit/miss evaluation, the model implements essential high-performance cache features such as MSHR handling, enabling a more faithful representation of highly concurrent shared cache memory behavior.
Simulator structure
All IP blocks operate on a clock-driven basis, with a global tick—defined and managed at the simulator’s top level—serving as the timing reference for all IP block cycles.
The simulator primarily comprises the following hardware components:
-
MU Thread Trace Manager – A simplified trace driver that substitutes for MU threads by issuing the provided MU memory trace to the cache and verifying the returned responses.
-
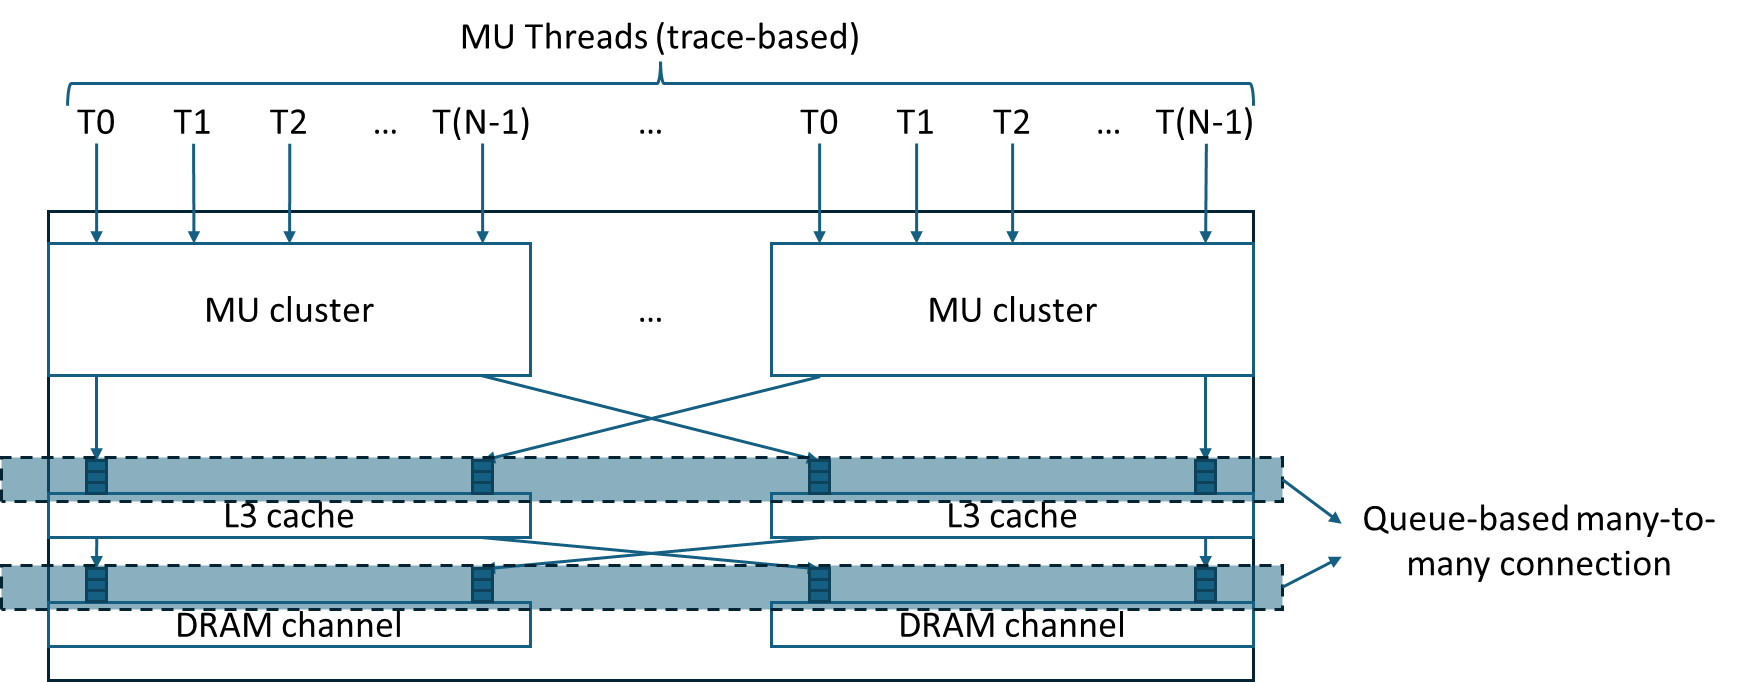
Cache Subsystem – Structured into L1/L2/L3 levels, where each cache level can be connected to varying numbers of upper- or lower-level IP blocks based on the input configuration. Core design parameters—such as the number of sets, associativity (ways), and line size—are fully configurable.
In the simulator, the connectivity between hardware blocks are configurable. For example, parameters such as the number of MU threads sharing a single L1 cache can be adjusted to observe the resulting performance variations.
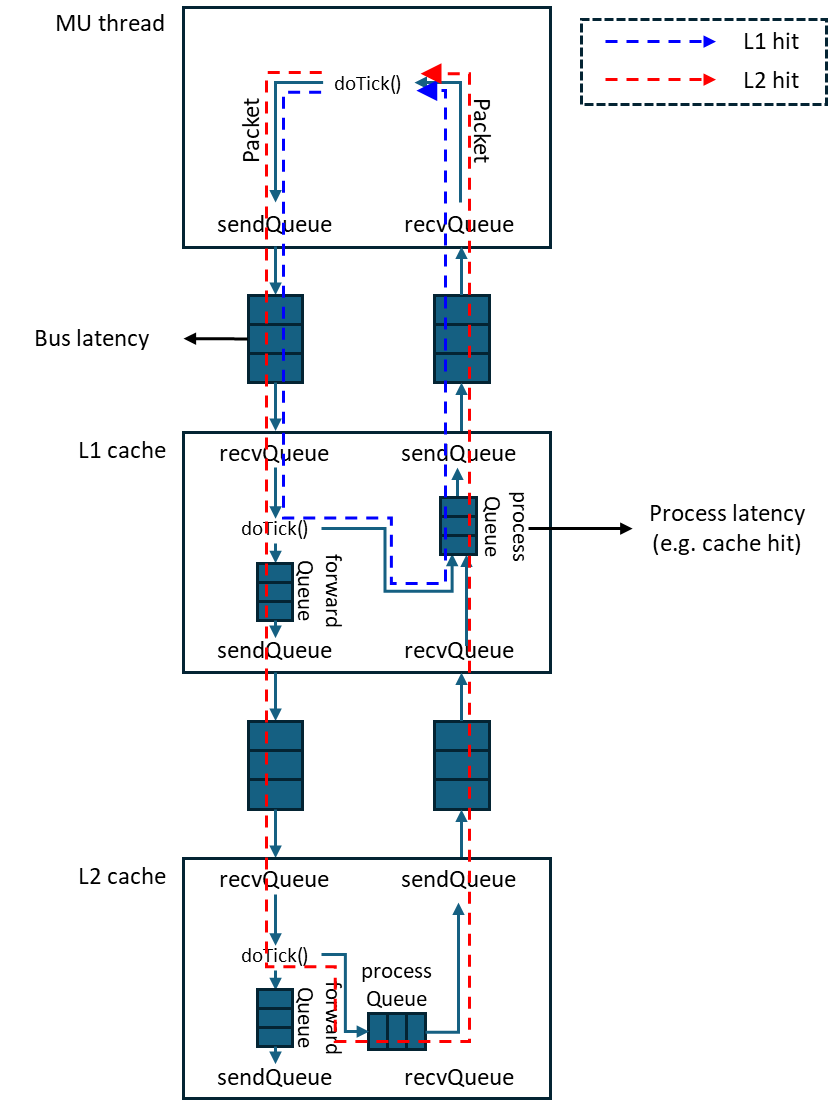
Each IP block is managed by a corresponding ModuleImpl/ClockImpl class, which contains a doTick function defining the operations performed by that IP block in a single cycle. The specific behavior of each IP block is implemented within its own doTick function. For example:
MU Thread: Reads the trace file, generates packets, and checks for the arrival of response packets.
Cache: Processes cache requests issued by MU threads, updates cache status based on response packets received from lower cache levels (or DRAM).
The ModuleImpl class also contains inbound and outbound interfaces that connect to other modules. Using the interface functions of the inbound/outbound classes, modules perform packet transmission and reception with one another.

During simulation, the cycles of each IP block are executed sequentially, starting from upstream modules (e.g., MU threads) and proceeding downstream (e.g., DRAM). After all IP blocks have advanced, the cycles of the TimerQueue modules that connect them are executed. Executing the TimerQueue cycles at the end ensures that the latencies defined in the TimerQueues are correctly reflected in the actual communication timing.
All modules containing IP blocks are interconnected via TimeQueues. Each upstream module (which generates requests) and downstream module (which processes requests and produces responses) is linked through TimerQueues. For every packet transfer direction between an upstream and downstream module, an independent TimerQueue is provided, thereby enabling concurrent bidirectional communication.
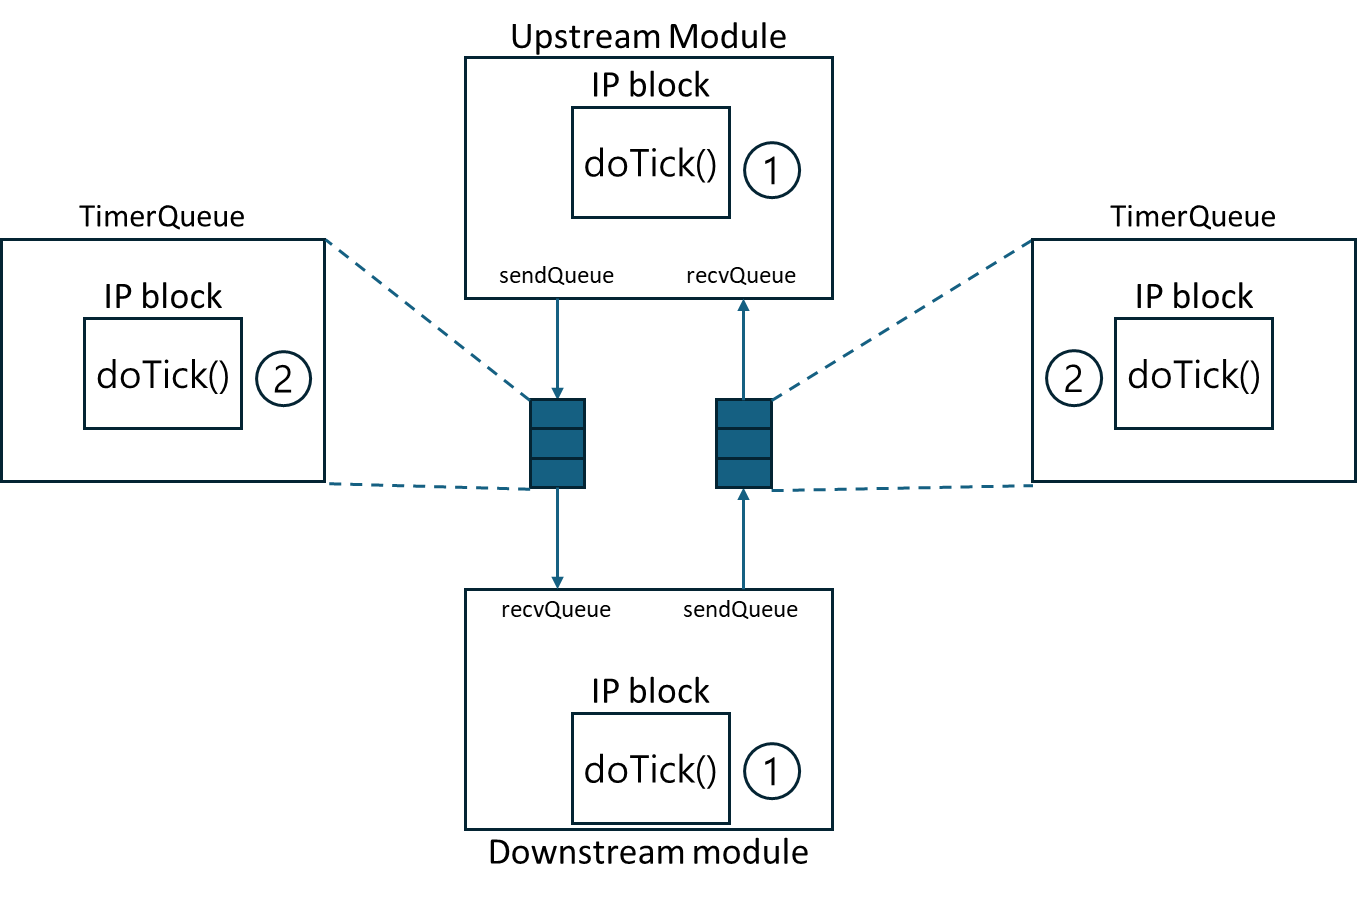
The doTick function of each IP block is responsible for receiving and processing incoming packets. If a packet can be handled within the IP itself, a reply packet is enqueued into the processQueue with a latency corresponding to the required processing time. If the packet cannot be processed internally and must be forwarded to another IP, it is instead enqueued into the forwardQueue. The entire sequence of operations for handling a packet is completed within a single invocation of the doTick function. The visibility of a processed packet is then regulated through the TimerQueue, which enforces the appropriate timing model.
IP block documentation
Cache
Each cache level handles both incoming requests from MU threads and responses at the head of its processQueue within a single invocation of the doTick function.
A basic form of MSHR (Miss Status Holding Register) without coherence-maintenance logic is employed. When a read/write access arrives for a cache entry that is already under miss handling, the access is merged into the existing entry. Once the first read response for that cacheline arrives, all pending requests associated with the entry are resolved.
The movement and update of actual data over the memory hierarchy is not modeled for simulation speed. It is assumed that all pending writes are applied with zero latency when the MSHR entry is released.
DRAM
The DRAM module is a simple component that accepts requests from all upstream modules (e.g., L3 cache slices) and processes them in FIFO order. Each request is serviced with a fixed latency (e.g., 100 cycles).
The number of outstanding requests that can be processed concurrently is controlled via the dram_process_queue_depth parameter.
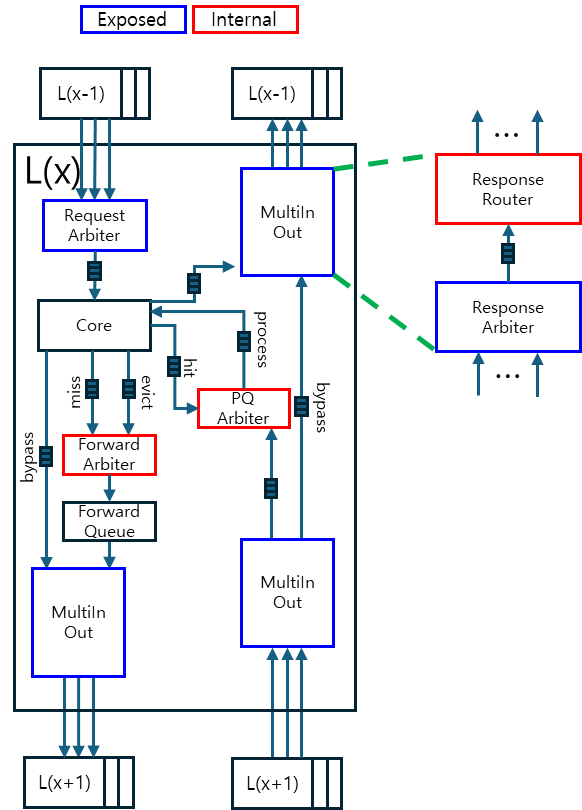
Arbiter
The arbiter is responsible for arbitration when a single IP block receives packets from multiple upstream IP blocks. The number of input ports is configurable at instantiation, while the output port is fixed at one.
Two arbitration policies are supported:
-
Least Recent Granted (LRG)
-
Round-Robin
Router
A router forwards a single input to one of multiple outputs based on packet information. The input port count is fixed at one, while the number of output ports is configurable.
Unlike the arbiter, the router does not require an arbitration algorithm; instead, the output destination is determined by inspecting the packet’s metadata (e.g., checking the address field to decide whether the access should be bypassed or serviced).
Multi-In-Out
The Multi-In-Out block provides M:N routing by combining an arbiter and a router into a single module. An M:1 arbiter first selects the packet to forward, and a 1:N router then delivers it to the designated downstream destination.
Appendix.A: MXPerfSim parameter description
mu_trace_prefix
Path to the directory containing MU thread trace files. Each trace file is named mu_thread_{thread ID}.txt. The simulator locates the corresponding file under this path and uses it as the input trace.
stats_file_prefix
Path to the directory where output statistics files are stored. During execution, interval-based statistics are generated at 1 ms simulation-time intervals, and aggregate statistics are produced at the end of the simulation.
- Interval statistics:
cluster_{#clusters}/interval_{interval}.txt - Aggregate statistics:
cluster_{#clusters}.txt
num_clusters
Total number of MU clusters.
num_l3_caches
Number of L3 caches (must be power of 2).
num_dram_channels
Number of DRAM channels (must be power of 2).
cluster_frequency ~ bus_frequency
Clock frequency (in GHz) for each component.
tick_granularity
Tick resolution of the simulation. A single tick corresponds to 1 ps of absolute time. For example, if this parameter is set to 250, the simulator polls all modules at 250 ps intervals to check whether their local clock domain has reached the next cycle, and then invokes the cycle() function if so.
l[x]_cache_size
Total cache size (bytes) for level x.
l3_cache_line_size
L3 cache line size (bytes).
l3_cache_way
L3 cache associativity (number of ways).
l3_mshr_size
Number of MSHR entries for L3 cache.
l3_repl_policy
Replacement policy for L3 cache. Supported options: lru, round_robin, random.
l3_hit_latency
L3 cache hit latency (in cycles).
dram_process_queue_depth
Maximum number of outstanding requests that a DRAM channel can process concurrently.
Appendix.B: Extending MX performance simulator with third-party simulators
MX performance simulator can be extended with third-party simulators to simulate different form of systems. For example, user can integrate customized core model instead of MU cluster model, or detailed DRAM simulator like DRAMSim or Ramulator instead of default FIFO-based DRAM model.
Any third-party simulator can be integrated with MXPerfSim as long as they can communicate with MXPerfSim using MXPerfSim’s packet interface. In other words, a translation layer to convert MXPerfSim’s packet from/to third-party simulators’ data flow abstraction is needed to integrate MXPerfSim with other simulators.
As described in “Simulator structure” section, hardware components of MXPerfSim is interconnected through timer-based queues. These queues are instantiated at buildSystem function in mx_simulator.cpp. Therefore, user can replace MU cluster or DRAM models to third-party simulators in buildSystem function by changing the hardware component instantiation part, and connect them to existing cache hierarchy of MXPerfSim by changing the queue instantiation part.
For example, if user wants to attach a custom CPU model on top of MXPerfSim’s cache hierarchy, following steps are needed for integration.
The code section below shows instantiation of hardware components in MxSimulator::buildSystem function. User can add custom CPU model by replacing MU cluster instantiation part (Line 1-2) by instantiation of custom CPU model.
1:  mxSubSystem_ = std::make_shared<MxSubSystem>();
2:  mxSubSystem_->buildMxSubSystem(config, ID);
3:
4:  std::string statsFilePrefix = config.getStr("stats_file_prefix");
5:  if (fs::exists(statsFilePrefix) == false)
6:  {
7:      fs::create_directories(statsFilePrefix);
8:  }
9:
10: // L3 cache creation
11: for (uint64_t i = 0; i < numL3Cache; i++)
12: {
13:     uint64_t tickPerCycle = static_cast<uint64_t>(1000.0 / l3CacheFreq);
14:     auto l3Cache = std::make_shared<BaseCache>(config, BaseCacheCore::BaseCacheCoreType::L3);
15:     l3Cache->getCacheCore()->setId(ID++);
16:     l3Cache->getCacheCore()->setCacheId(i);
17:     l3Cache->setTickPerCycle(tickPerCycle);
18:     l3Caches_.push_back(l3Cache);
19: }
20:
21: // DRAM channel creation
22: for (uint64_t i = 0; i < numDramChannel; i++)
23: {
24:     uint64_t tickPerCycle = static_cast<uint64_t>(1000.0 / dramChannelFreq);
25:     auto dramChannel = std::make_shared<DramChannel>(config);
26:     dramChannel->getDramCore()->setId(ID++);
27:     dramChannel->getDramCore()->setDramId(i);
28:     dramChannel->setTickPerCycle(tickPerCycle);
29:     dramChannels_.push_back(dramChannel);
30: }
And custom CPU model can be connected with other hardware components in MXPerfSim by modifying queue creation (Line 2-28) and attaching code (Line 30-31) in the same function.
1:  // Cluster <-> L3 cache connection
2:  std::vector<std::vector<std::shared_ptr<Inbound<std::shared_ptr<Packet>>>>> mxSubSystemDownstreamInbounds;
3:  std::vector<std::vector<std::shared_ptr<Outbound<std::shared_ptr<Packet>>>>> mxSubSystemDownstreamOutbounds;
4:  mxSubSystemDownstreamInbounds.resize(numClusters);
5:  mxSubSystemDownstreamOutbounds.resize(numClusters);
6:
7:  std::vector<std::vector<std::shared_ptr<Inbound<std::shared_ptr<Packet>>>>> l3UpstreamInbounds;
8:  std::vector<std::vector<std::shared_ptr<Outbound<std::shared_ptr<Packet>>>>> l3UpstreamOutbounds;
9:  l3UpstreamInbounds.resize(numL3Cache);
10: l3UpstreamOutbounds.resize(numL3Cache);
11:
12: for (uint64_t i = 0; i < numClusters; i++)
13: {
14:     for (uint64_t j = 0; j < numL3Cache; j++)
15:     {
16:         auto mxSubSystemOutboundL3InboundQ = std::make_shared<TimeQueue<std::shared_ptr<Packet>>>(busLatency, 1);
17:         mxSubSystemOutboundL3InboundQ->setTickPerCycle(busTickPerCycle);
18:         registerInterfaceClock(mxSubSystemOutboundL3InboundQ);
19:         mxSubSystemDownstreamOutbounds[i].push_back(mxSubSystemOutboundL3InboundQ);
20:         l3UpstreamInbounds[j].push_back(mxSubSystemOutboundL3InboundQ);
21:
22:         auto mxSubSystemInboundL3OutboundQ = std::make_shared<TimeQueue<std::shared_ptr<Packet>>>(busLatency, 1);
23:         mxSubSystemInboundL3OutboundQ->setTickPerCycle(busTickPerCycle);
24:         registerInterfaceClock(mxSubSystemInboundL3OutboundQ);
25:         mxSubSystemDownstreamInbounds[i].push_back(mxSubSystemInboundL3OutboundQ);
26:         l3UpstreamOutbounds[j].push_back(mxSubSystemInboundL3OutboundQ);
27:     }
28: }
29:
30: mxSubSystem_->setOutbounds(mxSubSystemDownstreamOutbounds);
31: mxSubSystem_->setInbounds(mxSubSystemDownstreamInbounds);
Note that the custom hardware model have to contain translation interface between MXPerfSim’s packet and the custom model’s own data flow abstraction.